
Quick answers
What is the RMSI 2012 report?
It is the National Report of a study titled Fire Hazard and Risk Analysis in the Country for Revamping the Fire Services in the Country, submitted in November 2012 by RMSI of Noida to the Home Ministry's fire directorate. It surveyed fire stations in all 35 States and Union Territories and calculated the gap against SFAC norms.
How big a gap did RMSI find?
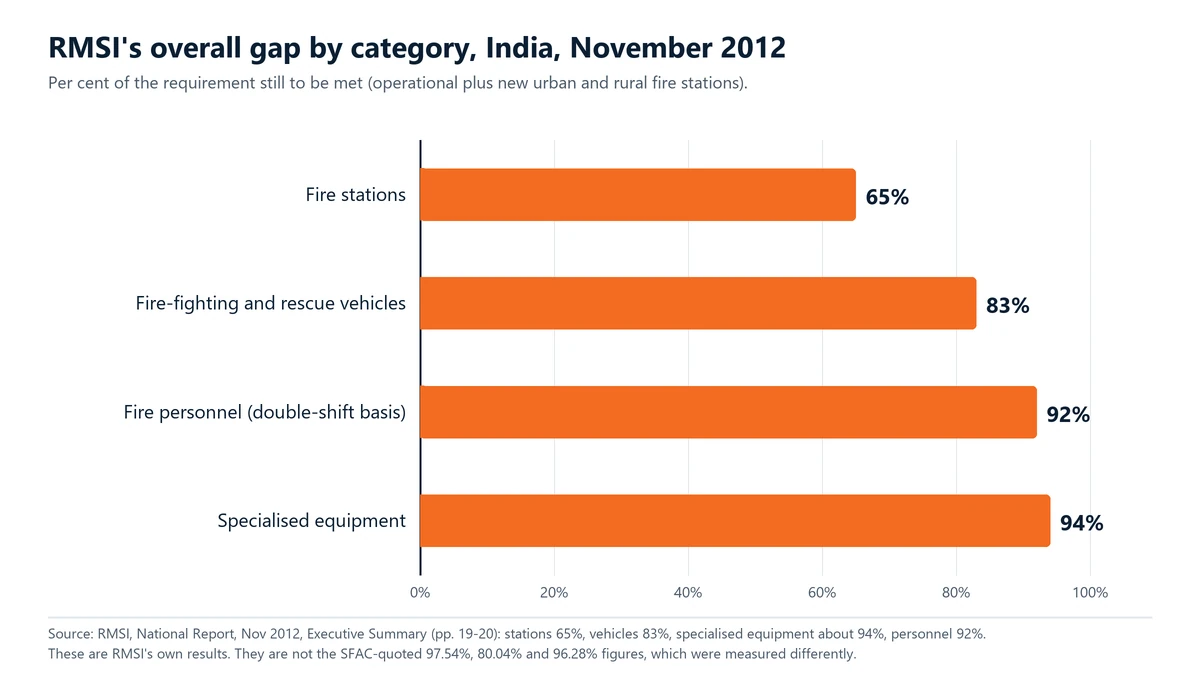
RMSI found a 65% gap in fire stations (5,619 more needed beside 2,980 existing), 83% in vehicles, about 94% in specialised equipment and 92% in personnel, on its own response-time and double-shift basis.
Is 97.54% RMSI's figure?
No. RMSI quotes 97.54% (stations), 80.04% (vehicles) and 96.28% (personnel) from an earlier analysis by the Standing Fire Advisory Council. RMSI's own findings are 65%, 83% and 92%.
Was the report linked to the Thirteenth Finance Commission?
We found no link in the report. Separately, the Thirteenth Finance Commission allocated Rs 472 crore for fire services in seven States in 2010-15, with Rs 404.65 crore released, according to a Lok Sabha reply of 22 November 2016.
How many fire stations did India have in 2018?
The Home Ministry told the Rajya Sabha that India had 3,377 fire stations on 31 December 2018, against a requirement shown as 8,559. RMSI's own table adds up to 8,599, and the two are not reconciled.
Has the gap closed since 2012?
We cannot say. The Home Ministry's 2018 counts are higher than RMSI's 2012 counts, but 18 State and UT rows show the same station count, and we found no later national count.
Is it true that India had one firefighter for every ten it needed in 2018?
That is a common reading of the Home Ministry's 2019 reply (54,239 personnel against 5,57,123), but the 5,57,123 is RMSI's additional need, not the total. RMSI put the gap at 92% in 2012 (51,163 in service, 5,59,681 more needed). The 54,239 reported for 2018 is less than one-tenth of the roughly 6.1 lakh that implies (our arithmetic), so the broad picture holds but the quoted figures were mislabelled.
What is the Rs 5,000 crore fire services scheme?
The Fifteenth Finance Commission earmarked Rs 5,000 crore from the NDRF for fire services over 2021-22 to 2025-26. The Home Ministry's scheme gives up to Rs 4,500 crore to States for new stations, training centres, vehicles, equipment and control rooms, and keeps Rs 500 crore as an incentive for reforms. States pay 25% (10% for the North-East and Himalayan States).
How fast should a fire engine reach me?
SFAC norms recommend 5 to 7 minutes in urban areas and 20 minutes in rural areas for the first fire engine. The Home Ministry calls the norms advisory, and no national average of actual response times has been published, so do not assume it.
What the RMSI report is
The full title is Fire Hazard and Risk Analysis in the Country for Revamping the Fire Services in the Country. The document we read is the “Final Report: National Report on Fire Hazard and Risk Analysis, Infrastructure and Institutional Assessment, and Key Recommendations”, dated November 2012. It was submitted to the Directorate General NDRF & Civil Defence (Fire), Ministry of Home Affairs, by RMSI of Sector 16, Noida. The Home Ministry told the Rajya Sabha on 26 June 2019 that its fire directorate engaged RMSI (which it calls Risk Management Solutions Inc.) in 2011, and it refers to the result as the “RMSI report 2012”. The study covered the whole country: 35 States and Union Territories, with a pilot in six of them (Jammu and Kashmir, Rajasthan, Maharashtra, Delhi, Andaman and Nicobar Islands, Puducherry) and the rest taken up in four later phases. RMSI’s team surveyed every fire station it could reach, using a headquarters form and a station form, and collected GPS locations. It then did four jobs. It ranked districts by fire hazard and risk using maps. It worked out where fire stations, vehicles, equipment and people were missing. It drew up a ten-year investment plan. And it built an open-source software tool, the Fire Decision Support System, to hold the data. Some limits are stated in the report itself. Forest-department fire services, private fire units, military cantonments and air bases, nuclear facilities, mines, ports, airports and refineries were left out. Census 2011 data were available only at district level. The fire load of individual industries was not measured. And uniform fire statistics for the past five years were not available across States.A note on the Finance Commission link
It is often said that this study came out of the Thirteenth Finance Commission. We did not find that in the report. The text we read never mentions the Finance Commission, and it describes the study as planned by the Directorate of NDRF & Civil Defence (Fire Cell) after a national analysis by the Standing Fire Advisory Council. What is documented is separate: the Home Ministry told the Lok Sabha on 22 November 2016 that the Thirteenth Finance Commission had allocated ₹472 crore for fire services in seven States during 2010-15, and that ₹404.65 crore had been released. Both are documented; we cannot say they are connected.The yardstick: SFAC norms
The Standing Fire Advisory Council (SFAC), which has representatives of every State, lays down norms for fire stations, equipment and manpower. For the first fire engine to reach a call, the norm is 3, 5 and 7 minutes in urban areas, depending on the risk category (A, B or C), and 20 minutes in rural areas. The same norms say one fire station for every 10 square km in urban areas and every 50 square km in rural areas. The Home Ministry has described these norms as advisory, and has called RMSI’s projected requirement “indicative in nature” (Lok Sabha reply, 22 November 2016). RMSI tested the two SFAC rules against each other by simulating fire-engine travel on the road network. It found they do not agree, because the area an engine can reach in five minutes depends on the roads. So it recommended response time as the main test: 5 to 7 minutes in urban areas and 20 minutes in rural areas. For vehicles it used the SFAC list with changes, for example one pumping unit for every 50,000 people up to 3 lakh. For personnel it used the Delhi Administrative Reforms Department norm for a double-shift roster, which it says is leaner than SFAC’s own.What RMSI found, in numbers
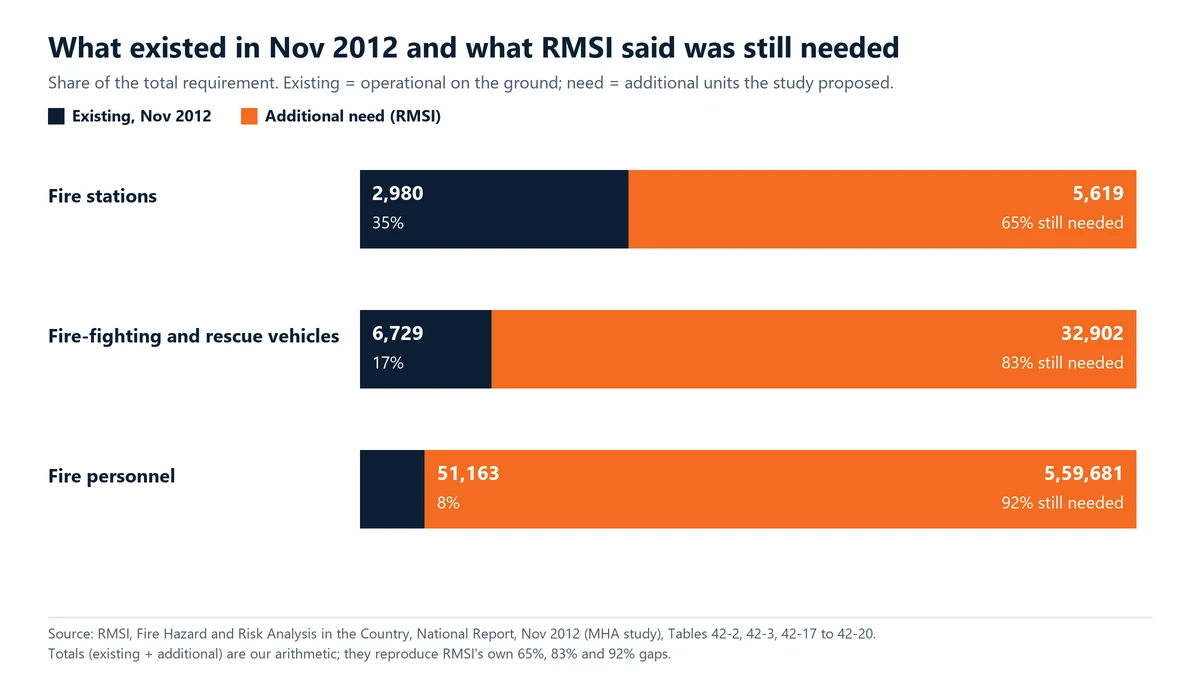
RMSI counted 2,987 operational fire stations in its executive summary and 2,980 in its detailed tables (the report explains that seven Jammu and Kashmir stations moved next to other stations were counted once). We use 2,980, the table figure, below. Against the requirement it calculated, it found a gap in every category.| Category | Existing, Nov 2012 | Additional need (RMSI) | Gap stated by RMSI |
|---|---|---|---|
| Fire stations | 2,980 | 5,619 (1,347 urban, 4,272 rural) | 65% |
| Fire-fighting and rescue vehicles | 6,729 | 32,902 | 83% |
| Specialised equipment | not totalled in the summary | not totalled in the summary | about 94% |
| Fire personnel (double-shift basis) | 51,163 | 5,59,681 | 92% |
Fire stations: urban and rural
RMSI marked an ideal response area around each working station and then looked for towns and villages left outside. The stations that existed in 2012 were, on this map, ideally serving about 39.3 crore people, or 32.5% of the Census 2011 population of 121.0 crore (our arithmetic). To cover the rest it proposed 1,347 new urban stations, ideally serving about 15.3 crore people, and 4,272 new rural stations or posts, ideally serving about 65.7 crore people. Rural posts were to be placed at larger villages of 5,000 to 10,000 people or at major road junctions. Put simply, there was about one fire station for every 4.06 lakh people in 2012 (2,980 stations, Census 2011 population; our arithmetic).Vehicles, equipment and people
For vehicles, the report counted 6,729 in 2012 and a gap of 32,902: 9,337 at existing stations, 4,275 more for the new urban stations (the difference between its Tables 42-4 and 42-5; our arithmetic) and 19,290 for rural stations. For personnel it counted 51,163 against a gap of 5,59,681: 2,19,477 at existing stations, 76,685 for new urban stations (again our subtraction) and 2,63,519 for rural ones. The specialised equipment gap, such as hydraulic rescue tools, breathing apparatus sets and thermal imaging cameras, was put at about 94%. Training was a gap of its own. Over ten years, RMSI estimated that 4,40,546 people would need basic fireman training and 2,51,913 refresher training, with 71,323 leading-fireman courses, 36,145 specialised courses, 52,161 junior-officer courses and 3,397 divisional-officer courses, if all the posts were filled.What else RMSI wrote
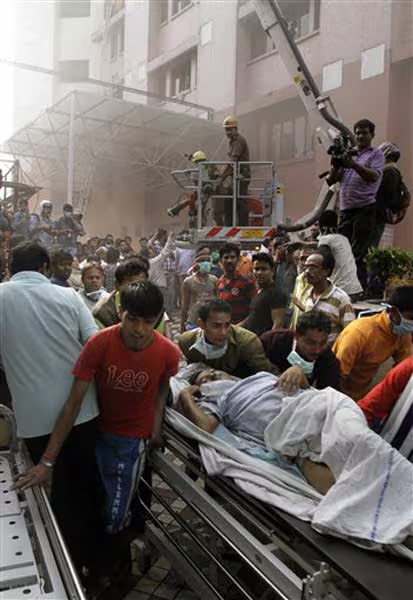
Beyond the counts, the report made 22 recommendations. A few stand out for ordinary readers. It asked for a Fire Prevention and Fire Safety Act in every State and Union Territory, with the National Building Code strictly followed in high-rise buildings, schools, cinema halls and hospitals. It asked for dedicated fire prevention wings and a fire education van in each district, saying such a wing might prevent a repeat of the AMRI hospital fire in Kolkata. It asked that fire engines not be used to clean drains or supply water, because a small fire could grow while the engine is away. It asked for quick-response vehicles and motorcycles with water-mist sets in congested lanes, and for roads to be widened and decongested so that engines can reach the scene. It also recommended that municipal fire services be brought under State fire services, since no single municipality can handle serious fires alone. RMSI also noted that ambulances attached to fire stations usually had no paramedic and little life-support equipment, and that many municipal services could not enforce fire safety rules for want of clear directions from the authorities that control them.Cost: what RMSI said it would take
RMSI estimated a ten-year investment of about ₹3,82,112 crore, including inflation, to fill every gap. Of this, about ₹2,79,125 crore is staff salary, which recurs each year. The rest is buildings (about ₹48,243 crore), vehicles and equipment (about ₹17,958 crore) and running costs. The report suggested a fire tax of 1% of property tax, a fire cess on safety inspections, paid training for private staff and plan-scrutiny fees as ways to raise money. These are 2012 estimates and should not be read as today’s cost.State by state
The table gives RMSI’s station figures for each State and Union Territory (Table 42-2, November 2012) and, in the last column, the number of stations the Home Ministry reported for 31 December 2018. The last column comes from a different document and must not be read as RMSI’s figure. Maharashtra had the most to add on RMSI’s count: 917 stations on top of its 157. Rajasthan needed 748 more, Bihar 548 and Uttar Pradesh 469. Delhi needed 55 more.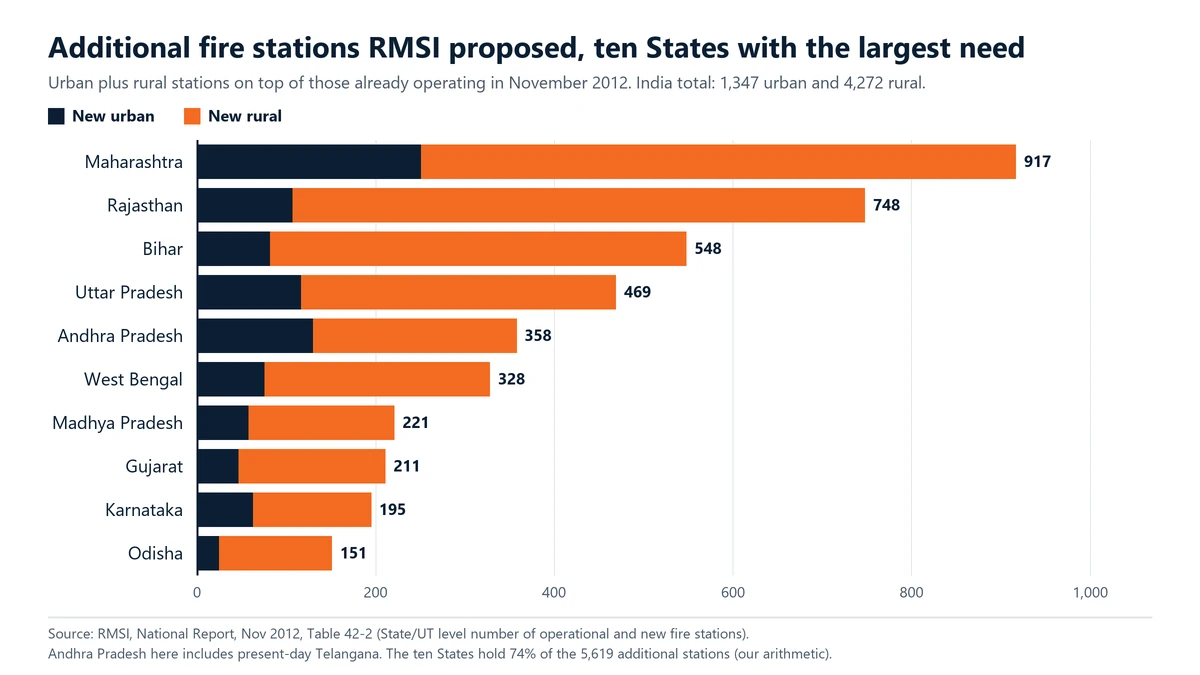
| State / UT | Operational, Nov 2012 | New urban | New rural | RMSI total | Share still to add | Reported, 31 Dec 2018 |
|---|---|---|---|---|---|---|
| Andaman & Nicobar Islands | 20 | 0 | 6 | 26 | 23% | 24 |
| Andhra Pradesh * | 251 | 130 | 228 | 609 | 59% | 346 |
| Arunachal Pradesh | 13 | 1 | 30 | 44 | 70% | 19 |
| Assam | 110 | 25 | 67 | 202 | 46% | 124 |
| Bihar | 102 | 82 | 466 | 650 | 84% | 107 |
| Chandigarh | 7 | 4 | 0 | 11 | 36% | 7 |
| Chhattisgarh | 33 | 14 | 103 | 150 | 78% | 33 |
| Dadra and Nagar Haveli | 1 | 1 | 4 | 6 | 83% | 1 |
| Daman and Diu | 3 | 3 | 0 | 6 | 50% | 3 |
| Delhi | 53 | 46 | 9 | 108 | 51% | 53 |
| Goa | 15 | 4 | 9 | 28 | 46% | 15 |
| Gujarat | 183 | 47 | 164 | 394 | 54% | 183 |
| Haryana | 82 | 34 | 80 | 196 | 58% | 82 |
| Himachal Pradesh | 25 | 11 | 83 | 119 | 79% | 25 |
| Jammu and Kashmir | 156 | 27 | 94 | 277 | 44% | 175 |
| Jharkhand | 31 | 12 | 137 | 180 | 83% | 33 |
| Karnataka | 182 | 63 | 132 | 377 | 52% | 195 |
| Kerala | 100 | 57 | 71 | 228 | 56% | 100 |
| Lakshadweep | 4 | 0 | 5 | 9 | 56% | 4 |
| Madhya Pradesh | 292 | 58 | 163 | 513 | 43% | 292 |
| Maharashtra | 157 | 251 | 666 | 1074 | 85% | 157 |
| Manipur | 16 | 11 | 26 | 53 | 70% | 16 |
| Meghalaya | 32 | 2 | 15 | 49 | 35% | 36 |
| Mizoram | 12 | 8 | 31 | 51 | 76% | 12 |
| Nagaland | 9 | 10 | 29 | 48 | 81% | 13 |
| Odisha | 180 | 25 | 126 | 331 | 46% | 340 |
| Puducherry | 13 | 4 | 0 | 17 | 24% | 13 |
| Punjab | 48 | 34 | 93 | 175 | 73% | 48 |
| Rajasthan | 126 | 107 | 641 | 874 | 86% | 126 |
| Sikkim | 9 | 1 | 15 | 25 | 64% | 10 |
| Tamil Nadu | 303 | 46 | 102 | 451 | 33% | 315 |
| Tripura | 35 | 3 | 15 | 53 | 34% | 40 |
| Uttar Pradesh | 237 | 117 | 352 | 706 | 66% | 253 |
| Uttarakhand | 33 | 33 | 58 | 124 | 73% | 35 |
| West Bengal | 107 | 76 | 252 | 435 | 75% | 142 |
| India | 2,980 | 1,347 | 4,272 | 8,599 | 65% | 3,377 |
A figure that is often mixed up
You may have seen “97.54% deficiency in fire stations, 80.04% in vehicles and 96.28% in personnel”. These numbers appear in the first pages of the RMSI report, but RMSI does not claim them. It quotes them as the result of “a recent analysis” by the Standing Fire Advisory Council, citing the NDMA guideline of 2012 and an SFAC paper of 2011. RMSI’s own findings are the lower percentages above: 65% for stations, 83% for vehicles and 92% for personnel. The two sets measure different things and should not be placed in one sentence as if they were the same finding.Why the gaps exist
The report’s first answer is structural. Fire service sits in the Twelfth Schedule of the Constitution as a municipal function, and it is run by the State or Union Territory and by urban local bodies. RMSI notes that in Maharashtra, Haryana, Gujarat, Chhattisgarh, Madhya Pradesh (except Indore) and Punjab it was then under municipal corporations, and under the Home Department in the rest. The Centre advises and supports, but the Home Ministry told the Lok Sabha in November 2016 that providing adequate fire stations is the primary responsibility of the municipal bodies and State governments. The second answer is history. RMSI says fire services grew “on an ad-hoc basis”, with no scientific study of risk, and that a lack of planning knowledge, institutions and funds were the main hurdles. Our own reading of the numbers adds a third point: the largest absolute gaps in 2012 were in big, populous States with many villages (Maharashtra, Rajasthan, Bihar, Uttar Pradesh), where a rural post is needed every few kilometres. A fire service built only around towns would not reach them.What has changed since 2012
The Thirteenth Finance Commission, 2010-15
The Home Ministry listed the Finance Commission’s fire grants in its Lok Sabha reply of 22 November 2016. They went to seven States only. The amounts are in rupees crore.| State | Allocation, 2010-15 | Released by 2014-15 |
|---|---|---|
| Andhra Pradesh (including Telangana) | 17.00 | 16.15 |
| Haryana | 100.00 | 100.00 |
| Mizoram | 20.00 | 16.00 |
| Odisha | 150.00 | 135.00 |
| Tripura | 15.00 | 15.00 |
| Uttar Pradesh | 20.00 | 10.00 |
| West Bengal | 150.00 | 112.50 |
| Total | 472.00 | 404.65 |
What the Home Ministry reported for 31 December 2018
On 26 June 2019 the Home Ministry gave the Rajya Sabha State-wise figures, collected from the States in 2018, under the heading “requirement as per RMSI report 2012”. For India as a whole it showed 3,377 fire stations against a requirement of 8,559; 54,239 personnel against a column headed requirement of 5,57,123; and 7,306 vehicles against 32,710. The last two requirement figures are not totals, as the third caution below explains. The station figures are the ones behind our report on how many fire stations India needs.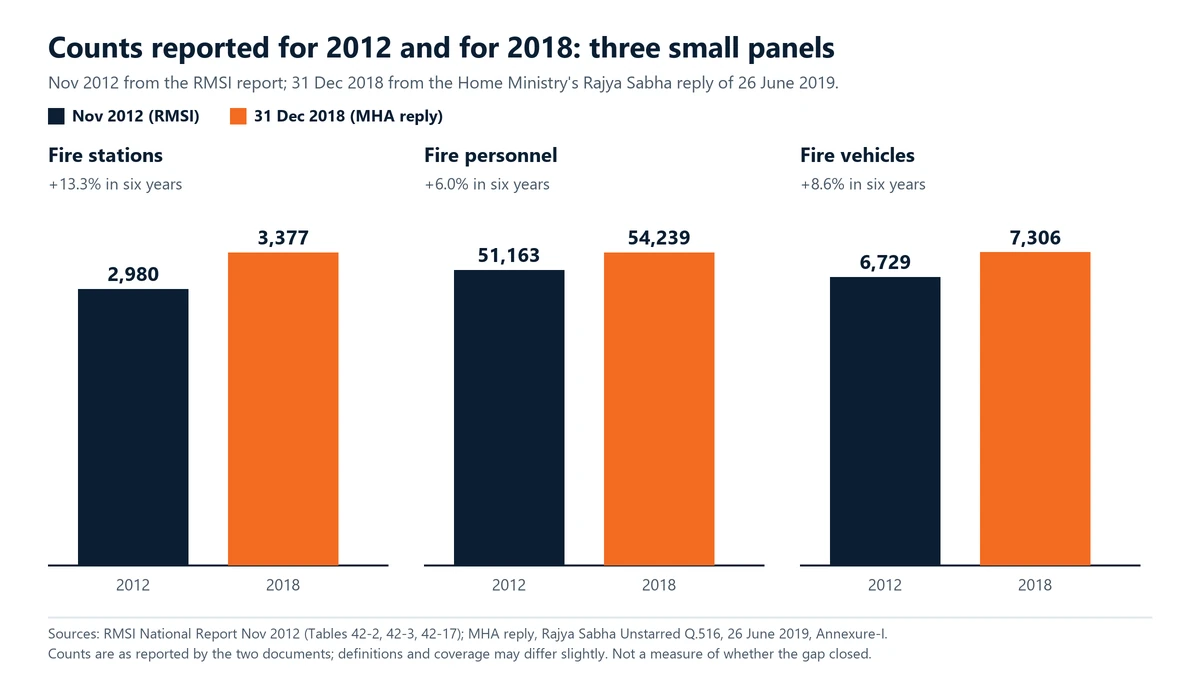
- Counts that did not move. In 18 of 35 State and Union Territory rows the 2018 station count is exactly the 2012 count, including Maharashtra (157), Delhi (53), Gujarat (183), Madhya Pradesh (292) and Rajasthan (126). Either no station was added or the figure was not refreshed; the documents do not say. Three rows account for 290 of the 397 net new stations: Odisha (180 to 340), Andhra Pradesh with Telangana (251 to 346) and West Bengal (107 to 142).
- The requirement figures differ. The 2019 reply adds up to 8,559 stations required. RMSI’s own Table 42-2 adds up to 8,599 (2,980 existing, 1,347 urban, 4,272 rural). The reply prints a national gap of 5,191, but 8,559 minus 3,377 is 5,182; the difference is Odisha, which reported 340 stations against a requirement of 331 and is shown with a gap of zero.
- Personnel and vehicles are not totals. For stations the reply’s “requirement” is a total: Maharashtra’s 1,074 is its 157 existing stations plus 917 more. For personnel and vehicles the same column matches the RMSI report’s additional need, not its total. Rajasthan’s personnel requirement in the reply is 29,937, against 29,936 additional personnel in RMSI’s own State table (6,367 + 4,720 + 18,849), and Delhi and Maharashtra also agree to within one post. For India the reply shows 5,57,123 personnel and 32,710 vehicles; RMSI’s additional need is 5,59,681 and 32,902, and its totals are 6,10,844 and 39,631 (our arithmetic). The reply’s printed gaps of 5,03,365 personnel and 25,460 vehicles then take the 2018 count off a second time, so we do not use them. On RMSI’s basis, the 54,239 personnel reported for 2018 are less than one-tenth of the roughly 6.1 lakh the study implies (our arithmetic).
The Fifteenth Finance Commission and the 2023 scheme
The Fifteenth Finance Commission earmarked ₹5,000 crore from the Preparedness and Capacity Building window of the National Disaster Response Fund (NDRF) for strengthening State fire services over 2021-22 to 2025-26. The Home Ministry framed a Scheme for Expansion and Modernization of Fire Services in the States and sent it to the States in July 2023. Its terms, from the scheme document:- Up to ₹4,500 crore goes to the States, in shares fixed by population (50%), area (25%) and urbanisation (25%). The other ₹500 crore is kept to reward States for legal and infrastructure reforms.
- States pay 25% of project cost; the North-Eastern and Himalayan States pay 10%. The States’ combined share works out to ₹1,387.99 crore against the Centre’s ₹4,499.84 crore.
- About 30% is for new fire stations (the document says roughly ₹6 crore for a two-bay station with a mini water tender and a water tender with rescue equipment), 5% for State training centres, 50% for modern vehicles, equipment and upgraded control rooms, and 15% for State-specific needs.
- No money may go to staff quarters, and salaries stay with the States. Funds are released in instalments against utilisation certificates.
Is there a national fire law?
Not that we could find. The Directorate General’s website carries a Model Bill to Provide for the Maintenance of a Fire and Emergency Service for the State, revised in 2019, and an older Model Fire Force Bill of 1958. These are templates for State legislatures, not central laws. The 2019 model provides for one fire service for the whole State, fire safety certificates, fire safety officers, a fire tax and a Fire Prevention and Life Safety Fund, several of which echo RMSI’s recommendations. We did not find a central fire safety bill before Parliament, and we cannot say how many States have adopted the model. We also did not look into whether the National Disaster Mitigation Fund pays for fire services; the 2023 scheme document names the NDRF window, not that fund.What the gaps mean for you
Everything above is the report and the official figures. What follows is our own practical advice, drawn from our other guides, and not a finding of the report. The report did not measure how long an engine takes to reach any particular street, and no national average is available. What it does show is that, on RMSI’s map, the stations then working could reach only about 32% of the population within the 5 to 7 minutes (cities) or 20 minutes (countryside) norm, and that is before asking whether each station had enough crew and engines. A gap this size means you should not plan on the fire brigade arriving before a small fire becomes a large one. The first few minutes belong to the people in the building.- Call early. Dial 101 for fire, 112 for any emergency and 108 for an ambulance. Say the building name, landmark and the nearest main road, and send someone to the gate to guide the engine in.
- Keep the way in clear. RMSI itself asked for roads to be widened and decongested so that engines can reach the scene faster. Keep your society gate, lane and driveway clear, and do not park across a fire lane.
- Look for the fire safety certificate, not just the fire station. RMSI says built-in fire safety arrangements and escape facilities are much more important than a fire service alone. Ask whether your building, school, hospital or shop has a valid Fire NOC and working alarms and exits, and read our guide to the Fire NOC in India for what to check.
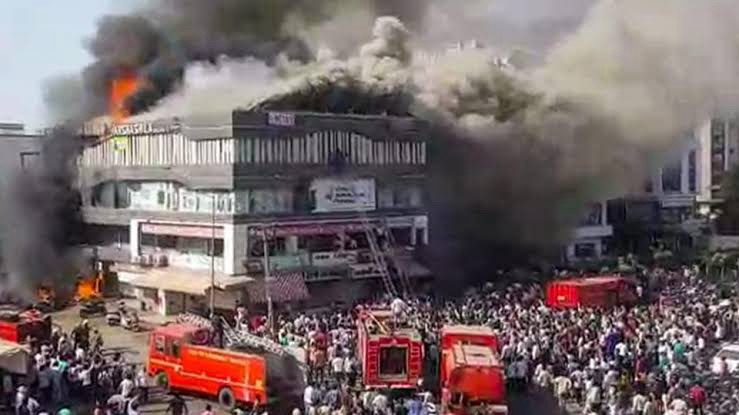
- Do not rely on the ladder. In the Takshashila Arcade fire in Surat in 2019, the only staircase filled with fire and smoke within minutes and the students on the top floor were trapped. A second exit and a short, practised drill matter more than the speed of the fire engine.
- Be ready for the first five minutes. Have a serviced extinguisher or a fire blanket for kitchens, a working smoke alarm, and a family plan for getting out.
- Ask your local representative. Which fire station is closest to your ward, and has it got a working engine and a full crew? RMSI’s report and the Home Ministry’s replies are public, and State figures are in the table above.
How we checked the figures
We read the RMSI National Report in full on 19 October 2026 from the Directorate General’s website, and read the Home Ministry’s Lok Sabha reply of 22 November 2016 and Rajya Sabha reply of 26 June 2019 through the Internet Archive’s saved copies, because the ministry’s site did not open for us. We read the 2023 scheme document, the Directorate General’s Model Bill of 2019 and the Tribune report of 29 March 2025. Where a total is ours rather than the report’s, the text says so. The report carries a “Confidential” footer on every page, although it is posted on the Directorate General’s public site.What needs attention
- RMSI found a gap of 65% in fire stations, 83% in vehicles, 92% in personnel and about 94% in specialised equipment.
- Stations existing in 2012 ideally served about 32.5% of the Census 2011 population on RMSI's response-time map (our arithmetic).
- The largest station gaps were in Maharashtra (917), Rajasthan (748), Bihar (548) and Uttar Pradesh (469).
- The 97.54%, 80.04% and 96.28% figures in the report are quoted from an SFAC analysis, not RMSI's own findings.
- The Home Ministry's 2018 counts are 13.3% higher for stations, 6.0% for personnel and 8.6% for vehicles than RMSI's 2012 counts, but 18 State and UT rows show an unchanged station count.
- The 2019 reply's requirement for stations (8,559) differs from the report's table total (8,599). Its personnel (5,57,123) and vehicle (32,710) "requirements" match RMSI's additional need, not its totals, so its printed gaps subtract the 2018 count a second time.
Controls that reduce risk
- Cite the document, table and date with every fire services figure you reuse.
- Ask your municipal corporation how many fire stations and working engines serve your ward.
- Check that your building has a valid Fire NOC and working alarms and exits.
- Keep your society gate and lane clear so an engine can enter.
- Keep 101, 112 and 108 saved in every phone.
- Keep a serviced extinguisher or fire blanket and a practised family exit plan.
Common unsafe practices
- Quoting 97.54% as an RMSI finding when the report quotes it from the Standing Fire Advisory Council.
- Putting 2012 and 2018 figures in one sentence without saying which is which.
- Reading the SFAC norms as law when the Home Ministry calls them advisory.
- Reading RMSI's requirement as exact, when the Home Ministry calls it indicative.
- Treating the 2019 reply's personnel requirement of 5,57,123 as a total, when it matches RMSI's additional need, and quoting its printed gap of 5,03,365.
- Saying a fire brigade will arrive in five minutes because the norm says so.


Leave a comment