
Quick answers
Which accident causes killed the most people in India in 2024?
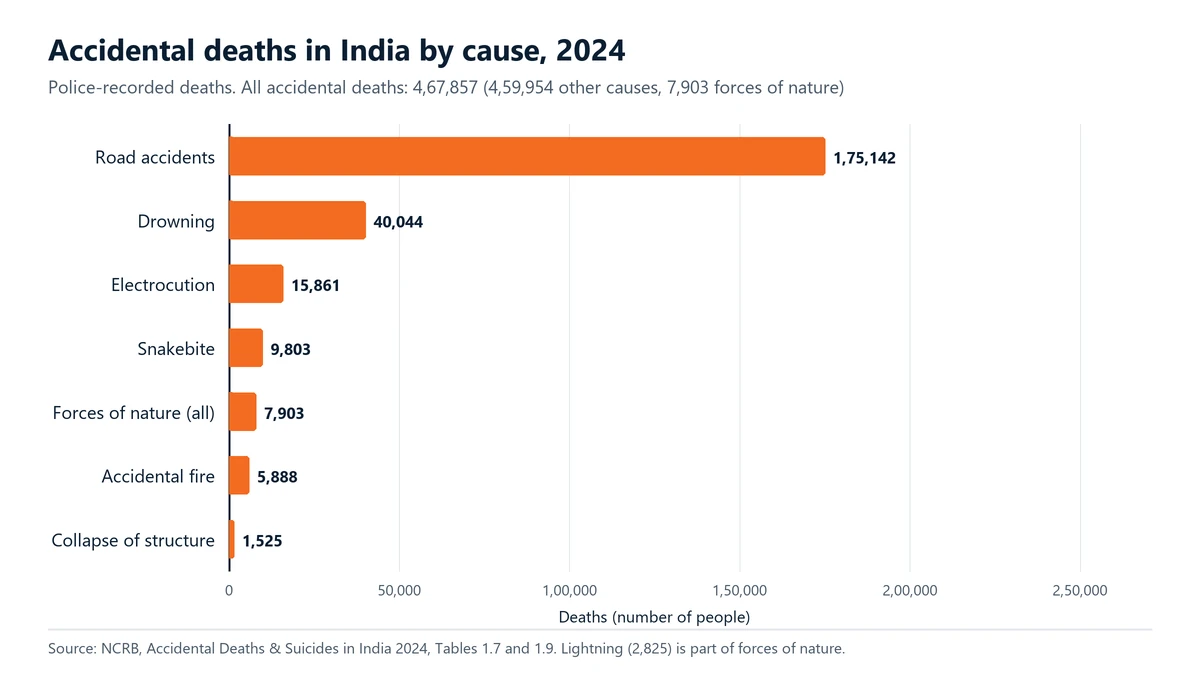
Road accidents, with 1,75,142 deaths recorded by police, far ahead of drowning (40,044), electrocution (15,861) and snakebite (9,803), according to NCRB ADSI 2024, Table 1.7.
Which State had the most accidental deaths in 2024?
Maharashtra, with 75,807 deaths (16.2% of the national total), followed by Madhya Pradesh (45,695) and Uttar Pradesh (42,987). On NCRB's own rate per lakh population, Maharashtra stood at 59.4 against 33.3 for India.
Does a higher number of deaths mean a State is more dangerous?
Not by itself. Large States have more people, so they record more deaths. A fair comparison needs deaths per lakh population on one official population basis, which NCRB's Chapter 1 gives only for all accidental deaths together.
How much did heat stroke deaths rise in 2024?
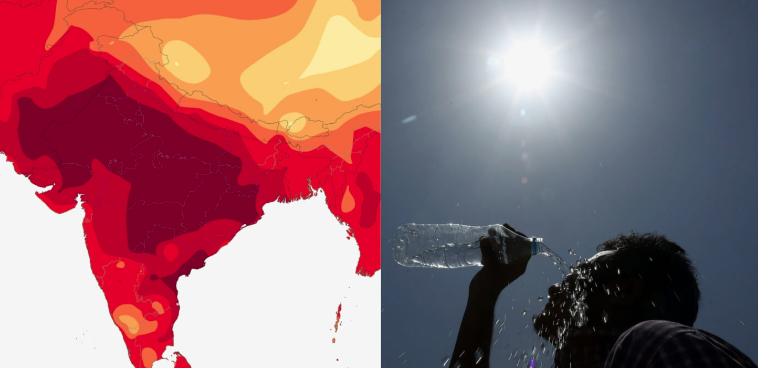
NCRB recorded 1,832 heat and sun stroke deaths in 2024 against 804 in 2023, from Table 1.9.
Is the NCRB snakebite figure the real number of deaths?
No. NCRB counts 9,803 deaths recorded by police in 2024. The WHO, citing a 2020 study, puts the average at 58,000 deaths a year in India between 2000 and 2019.
Why does Odisha show zero electrocution deaths for 2023?
NCRB Table 1.10 for 2023 prints 0 for Odisha, which looks like a reporting gap, since other large States record hundreds. We have not compared Odisha's 2023 and 2024 electrocution figures.
Can I use these figures in my article or project?
Yes. Use the NCRB tables as your primary source, cite the table number and year, and link to the NCRB PDF. For the State rankings and 2023 comparison on this page, please credit HowToSurvive.in as the compiler.
Every year the National Crime Records Bureau (NCRB) publishes one of the very few national counts of how Indians die in accidents. Its 2024 edition of Accidental Deaths & Suicides in India (ADSI) records 4,67,857 accidental deaths, which is about 1,280 people every day. Most of them died on the road. Many more drowned in a pond or river, touched a live wire, or stood under a tree in a thunderstorm. This page puts the official figures in one place: totals by cause, the ten States with the most deaths for each major cause, a full State-by-State table, and a plain note on what these numbers can and cannot tell you.
The headline numbers for 2024
NCRB counted 4,67,857 accidental deaths in 2024, up 5.3% from 4,44,104 in 2023. Of these, 4,59,954 (98.3%) came under what NCRB calls “other causes”, such as road crashes, drowning, fire and electrocution, and 7,903 (1.7%) came under “forces of nature”, such as lightning, heat stroke, flood and landslide. NCRB’s own rate for 2024 is 33.3 accidental deaths per lakh population, worked out on the mid-year projected population of 14,049.1 lakh given by the National Commission on Population.
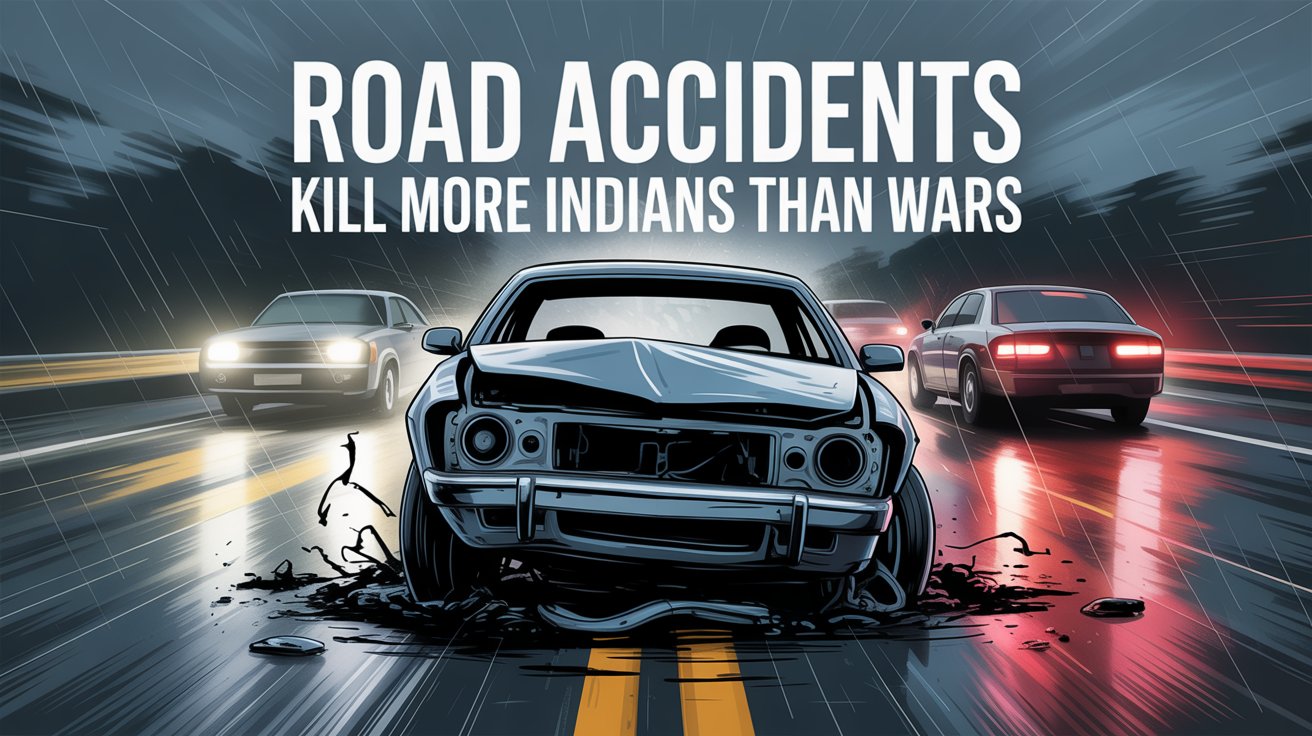
Road accidents alone caused 1,75,142 deaths, or 37.4% of all accidental deaths. NCRB also files 76,024 “sudden deaths” (mostly heart attacks) and 21,747 poisonings, but this page sticks to the hazards that people can prepare for at home, on the road and in the open.
All-India deaths by cause
The table below is from NCRB Table 1.7 (other causes) and Table 1.9 (forces of nature). Each figure is the number of people who died, as recorded by police. The change column is our own arithmetic from the two years.
| Cause | 2024 deaths | 2023 deaths | Change |
|---|---|---|---|
| Road accidents | 1,75,142 | 1,73,826 | +0.8% |
| Drowning | 40,044 | 37,738 | +6.1% |
| Falls | 26,437 | 25,150 | +5.1% |
| Electrocution | 15,861 | 13,835 | +14.6% |
| Snakebite | 9,803 | 10,118 | -3.1% |
| Other animal, reptile and insect bites | 1,312 | 1,170 | +12.1% |
| Accidental fire | 5,888 | 6,891 | -14.6% |
| Collapse of structures (all kinds) | 1,525 | 1,644 | -7.2% |
| Accidental explosion | 360 | 498 | -27.7% |
| Stampede | 147 | 32 | +359.4% |
| Forces of nature (all natural causes) | 7,903 | 6,444 | +22.6% |
| Lightning (part of forces of nature) | 2,825 | 2,560 | +10.4% |
| Heat and sun stroke (part of forces of nature) | 1,832 | 804 | +127.9% |
| Flood (part of forces of nature) | 361 | 266 | +35.7% |
| All accidental deaths | 4,67,857 | 4,44,104 | +5.3% |
Two things to keep in mind. First, “traffic accidents” in NCRB’s tables (1,99,443 deaths in 2024) also include deaths on railway tracks and at level crossings; the road figure used here is the separate “road accidents” line. Second, the biggest jumps in 2024 were in heat and sun stroke, which rose from 804 to 1,832 deaths, and in stampedes, from 32 to 147. Fire deaths fell by 14.6%. Our guide to heat stroke deaths in India goes into the heat figures in more detail.
Road accidents: the ten States with the most deaths
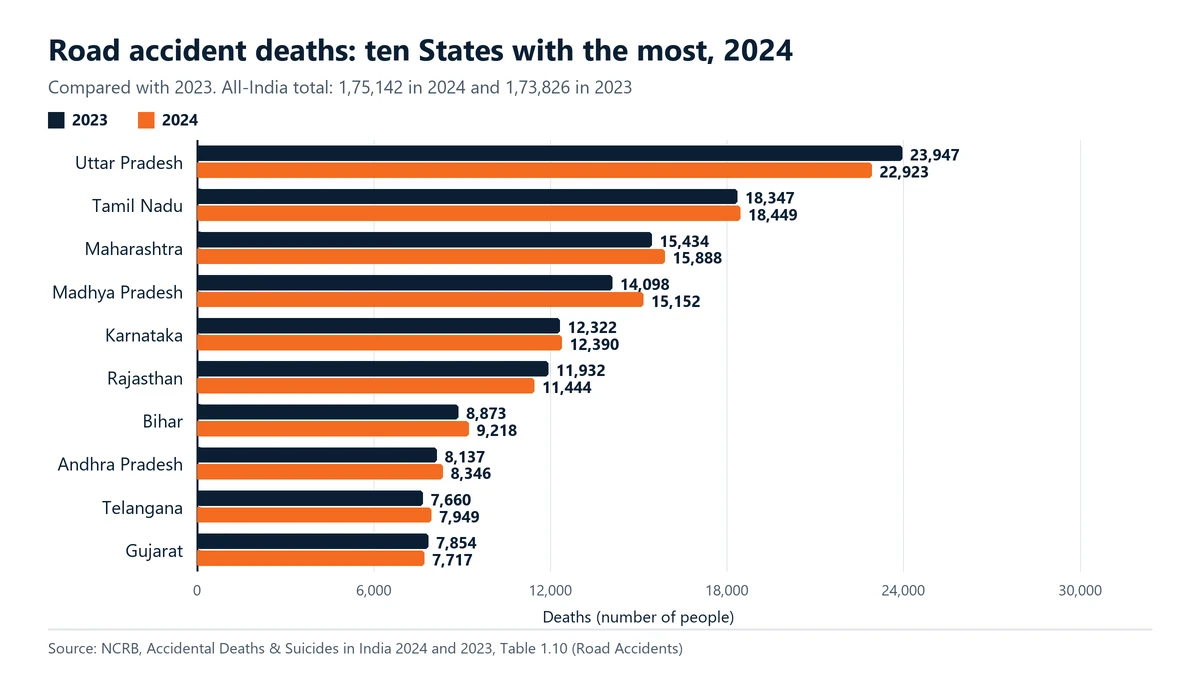
Road accidents took 1,75,142 lives in 2024, against 1,73,826 in 2023. Uttar Pradesh recorded 22,923 deaths, 13.1% of the national figure, followed by Tamil Nadu (18,449) and Maharashtra (15,888). The top three States account for 32.7% of all road deaths and the top ten for 73.9%. Uttar Pradesh recorded fewer deaths than in 2023, while Madhya Pradesh recorded 7.5% more. Our piece on why India treats road deaths as routine looks at what sits behind the national number.
| Rank | State | 2024 deaths | 2023 deaths | Change | Share of India, 2024 |
|---|---|---|---|---|---|
| 1 | Uttar Pradesh | 22,923 | 23,947 | -4.3% | 13.1% |
| 2 | Tamil Nadu | 18,449 | 18,347 | +0.6% | 10.5% |
| 3 | Maharashtra | 15,888 | 15,434 | +2.9% | 9.1% |
| 4 | Madhya Pradesh | 15,152 | 14,098 | +7.5% | 8.7% |
| 5 | Karnataka | 12,390 | 12,322 | +0.6% | 7.1% |
| 6 | Rajasthan | 11,444 | 11,932 | -4.1% | 6.5% |
| 7 | Bihar | 9,218 | 8,873 | +3.9% | 5.3% |
| 8 | Andhra Pradesh | 8,346 | 8,137 | +2.6% | 4.8% |
| 9 | Telangana | 7,949 | 7,660 | +3.8% | 4.5% |
| 10 | Gujarat | 7,717 | 7,854 | -1.7% | 4.4% |
Drowning: the ten States with the most deaths
Drowning is the second biggest cause on this page, with 40,044 deaths in 2024 against 37,738 in 2023. NCRB counts most of them as accidental falls into a water body (31,210 deaths), then other cases (8,729), and a small number as boat capsizes (105). Maharashtra (5,151) and Madhya Pradesh (5,094) are close together at the top. Bihar jumped from 2,249 to 3,624 deaths, a rise of 61.1%; NCRB does not explain why. Our water safety guide covers rivers, ponds and wells.
| Rank | State | 2024 deaths | 2023 deaths | Change | Share of India, 2024 |
|---|---|---|---|---|---|
| 1 | Maharashtra | 5,151 | 4,548 | +13.3% | 12.9% |
| 2 | Madhya Pradesh | 5,094 | 5,149 | -1.1% | 12.7% |
| 3 | Bihar | 3,624 | 2,249 | +61.1% | 9.1% |
| 4 | Uttar Pradesh | 3,195 | 3,199 | -0.1% | 8.0% |
| 5 | Rajasthan | 2,533 | 2,478 | +2.2% | 6.3% |
| 6 | Karnataka | 2,369 | 2,598 | -8.8% | 5.9% |
| 7 | Tamil Nadu | 2,362 | 2,094 | +12.8% | 5.9% |
| 8 | Chhattisgarh | 2,144 | 2,082 | +3.0% | 5.4% |
| 9 | Gujarat | 1,999 | 1,956 | +2.2% | 5.0% |
| 10 | Odisha | 1,984 | 2,066 | -4.0% | 5.0% |
Electrocution: the ten States with the most deaths
Electrocution killed 15,861 people in 2024, up 14.6% from 13,835. Madhya Pradesh (2,597), Rajasthan (1,803) and Maharashtra (1,651) lead, and the top ten States account for 82.7% of the total. Bihar’s count rose from 685 to 1,185. Odisha is not in the 2024 top ten, and its 2023 row shows 0 electrocution deaths, which looks like a gap in reporting rather than a real zero. We have therefore not compared it. If you live with old wiring or work near overhead lines, start with our home electrical safety guide.
| Rank | State | 2024 deaths | 2023 deaths | Change | Share of India, 2024 |
|---|---|---|---|---|---|
| 1 | Madhya Pradesh | 2,597 | 2,240 | +15.9% | 16.4% |
| 2 | Rajasthan | 1,803 | 1,749 | +3.1% | 11.4% |
| 3 | Maharashtra | 1,651 | 1,505 | +9.7% | 10.4% |
| 4 | Uttar Pradesh | 1,435 | 1,500 | -4.3% | 9.0% |
| 5 | Bihar | 1,185 | 685 | +73.0% | 7.5% |
| 6 | Gujarat | 982 | 916 | +7.2% | 6.2% |
| 7 | Tamil Nadu | 964 | 767 | +25.7% | 6.1% |
| 8 | Andhra Pradesh | 915 | 995 | -8.0% | 5.8% |
| 9 | Telangana | 842 | 855 | -1.5% | 5.3% |
| 10 | Karnataka | 742 | 582 | +27.5% | 4.7% |
Accidental fire: the ten States with the most deaths
NCRB recorded 5,888 fire-accident deaths in 2024, down from 6,891. Maharashtra (639), Tamil Nadu (537) and Uttar Pradesh (489) are the top three. Uttar Pradesh is the only State in the top five where fire deaths rose, from 374 to 489. Odisha’s count fell from 1,032 to 442, a drop of 57.2%, which is large enough that you should not read it as a real improvement without checking how the State recorded its deaths. What causes these fires, and why homes are the main danger, is covered in our guide to NCRB fire data for 2024.
| Rank | State | 2024 deaths | 2023 deaths | Change | Share of India, 2024 |
|---|---|---|---|---|---|
| 1 | Maharashtra | 639 | 697 | -8.3% | 10.9% |
| 2 | Tamil Nadu | 537 | 616 | -12.8% | 9.1% |
| 3 | Uttar Pradesh | 489 | 374 | +30.7% | 8.3% |
| 4 | Madhya Pradesh | 452 | 597 | -24.3% | 7.7% |
| 5 | Odisha | 442 | 1,032 | -57.2% | 7.5% |
| 6 | Karnataka | 388 | 466 | -16.7% | 6.6% |
| 7 | Chhattisgarh | 350 | 438 | -20.1% | 5.9% |
| 8 | Bihar | 321 | 374 | -14.2% | 5.5% |
| 9 | Andhra Pradesh | 316 | 328 | -3.7% | 5.4% |
| 10 | Rajasthan | 302 | 322 | -6.2% | 5.1% |
Snakebite: the ten States with the most deaths
Police recorded 9,803 snakebite deaths in 2024 and 10,118 in 2023. Madhya Pradesh alone recorded 2,271, which is 23.2% of the national figure. Madhya Pradesh, Chhattisgarh and Odisha together account for 44.3%. NCRB files these deaths under “poisoning”. They are almost certainly an undercount: the World Health Organization, citing a 2020 study, puts the average at 58,000 snakebite deaths a year in India between 2000 and 2019.
| Rank | State | 2024 deaths | 2023 deaths | Change | Share of India, 2024 |
|---|---|---|---|---|---|
| 1 | Madhya Pradesh | 2,271 | 2,294 | -1.0% | 23.2% |
| 2 | Chhattisgarh | 1,047 | 840 | +24.6% | 10.7% |
| 3 | Odisha | 1,029 | 1,127 | -8.7% | 10.5% |
| 4 | Uttar Pradesh | 928 | 938 | -1.1% | 9.5% |
| 5 | Rajasthan | 739 | 876 | -15.6% | 7.5% |
| 6 | Maharashtra | 675 | 748 | -9.8% | 6.9% |
| 7 | West Bengal | 502 | 454 | +10.6% | 5.1% |
| 8 | Karnataka | 497 | 720 | -31.0% | 5.1% |
| 9 | Bihar | 478 | 365 | +31.0% | 4.9% |
| 10 | Tamil Nadu | 449 | 541 | -17.0% | 4.6% |
Lightning: the ten States with the most deaths
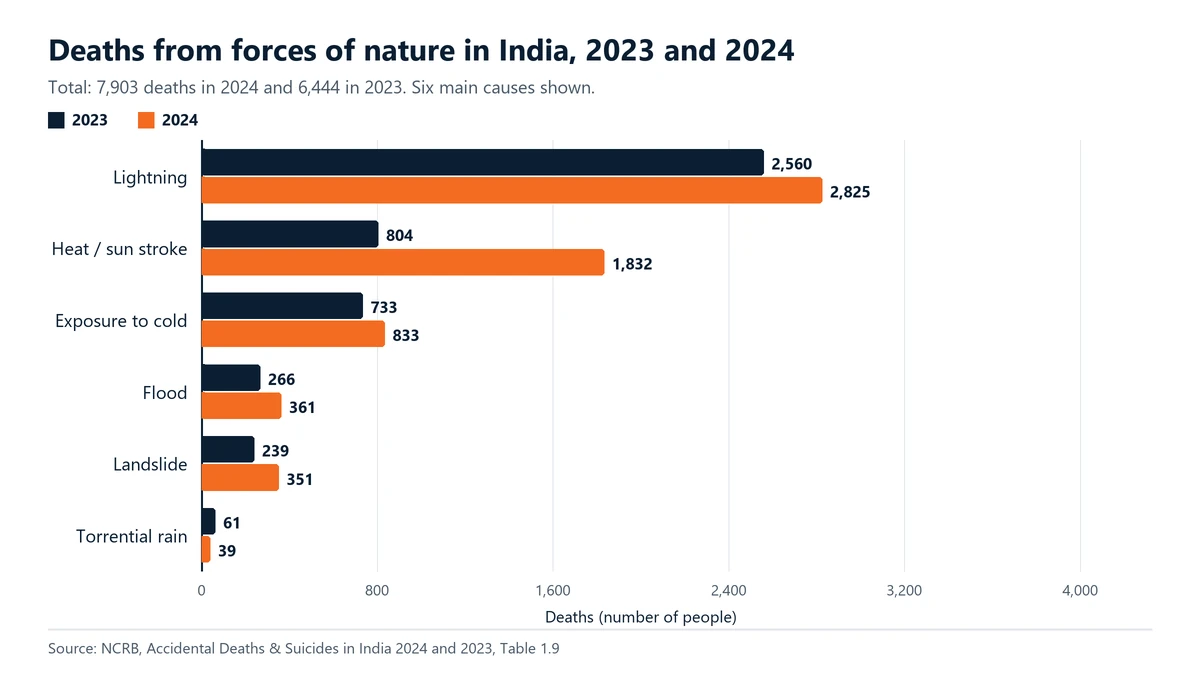
Lightning is the biggest single natural cause in NCRB’s count, with 2,825 deaths in 2024 against 2,560 in 2023. It accounts for 35.7% of all deaths from forces of nature. Madhya Pradesh (577) and Bihar (360) are well ahead of the rest. In West Bengal, NCRB says lightning caused 159 of the 185 natural-cause deaths (85.9%). If you are caught outdoors when thunder starts, our guide on where to shelter from lightning tells you what to do.
| Rank | State | 2024 deaths | 2023 deaths | Change | Share of India, 2024 |
|---|---|---|---|---|---|
| 1 | Madhya Pradesh | 577 | 397 | +45.3% | 20.4% |
| 2 | Bihar | 360 | 345 | +4.3% | 12.7% |
| 3 | Uttar Pradesh | 275 | 287 | -4.2% | 9.7% |
| 4 | Odisha | 249 | 294 | -15.3% | 8.8% |
| 5 | Chhattisgarh | 241 | 180 | +33.9% | 8.5% |
| 6 | Jharkhand | 211 | 194 | +8.8% | 7.5% |
| 7 | Maharashtra | 192 | 180 | +6.7% | 6.8% |
| 8 | West Bengal | 159 | 143 | +11.2% | 5.6% |
| 9 | Rajasthan | 100 | 108 | -7.4% | 3.5% |
| 10 | Telangana | 97 | 47 | +106.4% | 3.4% |
The chart above also shows the other main natural causes. Torrential rain was the only one of the six that fell in 2024; heat and sun stroke more than doubled, as noted earlier.
All States and Union Territories
The table lists every State and Union Territory in descending order of total accidental deaths in 2024. All figures are the numbers of people who died, from NCRB Table 1.10 (road, drowning, electrocution, fire and snakebite) and Table 1.9 (lightning). The first column adds Tables 1.9 and 1.10 and matches the State-wise figures NCRB prints in Chapter 1 (Figure 1.2).
| State / UT | All accidental deaths | Road accidents | Drowning | Electrocution | Fire | Snakebite | Lightning |
|---|---|---|---|---|---|---|---|
| Maharashtra | 75,807 | 15,888 | 5,151 | 1,651 | 639 | 675 | 192 |
| Madhya Pradesh | 45,695 | 15,152 | 5,094 | 2,597 | 452 | 2,271 | 577 |
| Uttar Pradesh | 42,987 | 22,923 | 3,195 | 1,435 | 489 | 928 | 275 |
| Tamil Nadu | 33,747 | 18,449 | 2,362 | 964 | 537 | 449 | 66 |
| Karnataka | 31,034 | 12,390 | 2,369 | 742 | 388 | 497 | 87 |
| Rajasthan | 30,794 | 11,444 | 2,533 | 1,803 | 302 | 739 | 100 |
| Gujarat | 23,934 | 7,717 | 1,999 | 982 | 245 | 240 | 62 |
| Odisha | 23,437 | 6,142 | 1,984 | 455 | 442 | 1,029 | 249 |
| Bihar | 19,648 | 9,218 | 3,624 | 1,185 | 321 | 478 | 360 |
| Haryana | 18,308 | 5,187 | 711 | 408 | 153 | 73 | 5 |
| Chhattisgarh | 17,251 | 7,059 | 2,144 | 643 | 350 | 1,047 | 241 |
| Andhra Pradesh | 17,028 | 8,346 | 1,403 | 915 | 316 | 294 | 74 |
| Kerala | 16,794 | 3,876 | 1,385 | 173 | 144 | 51 | 13 |
| West Bengal | 14,586 | 5,148 | 980 | 247 | 302 | 502 | 159 |
| Telangana | 13,458 | 7,949 | 1,647 | 842 | 121 | 191 | 97 |
| Punjab | 12,113 | 4,936 | 480 | 234 | 140 | 72 | 8 |
| Jharkhand | 8,767 | 4,114 | 898 | 162 | 258 | 194 | 211 |
| Assam | 5,698 | 3,351 | 866 | 102 | 24 | 6 | 30 |
| Delhi | 3,722 | 1,551 | 131 | 88 | 103 | 12 | 0 |
| Himachal Pradesh | 3,204 | 864 | 208 | 40 | 71 | 36 | 2 |
| Uttarakhand | 2,664 | 1,082 | 289 | 42 | 16 | 13 | 1 |
| Jammu & Kashmir | 1,211 | 840 | 28 | 20 | 9 | 1 | 1 |
| Puducherry | 1,209 | 158 | 78 | 22 | 9 | 2 | 0 |
| Chandigarh | 834 | 63 | 1 | 3 | 0 | 0 | 0 |
| Tripura | 673 | 226 | 75 | 30 | 4 | 0 | 7 |
| Goa | 640 | 289 | 100 | 20 | 9 | 3 | 1 |
| Meghalaya | 614 | 196 | 89 | 17 | 4 | 0 | 4 |
| Arunachal Pradesh | 371 | 158 | 47 | 7 | 4 | 0 | 0 |
| Dadra & Nagar Haveli and Daman & Diu | 334 | 93 | 51 | 2 | 7 | 0 | 0 |
| Sikkim | 327 | 71 | 21 | 8 | 6 | 0 | 2 |
| Mizoram | 307 | 73 | 29 | 11 | 16 | 0 | 0 |
| Manipur | 216 | 72 | 28 | 6 | 1 | 0 | 1 |
| Andaman & Nicobar Islands | 206 | 31 | 23 | 3 | 4 | 0 | 0 |
| Ladakh | 193 | 61 | 12 | 0 | 1 | 0 | 0 |
| Nagaland | 44 | 25 | 7 | 2 | 1 | 0 | 0 |
| Lakshadweep | 2 | 0 | 2 | 0 | 0 | 0 | 0 |
| All India | 4,67,857 | 1,75,142 | 40,044 | 15,861 | 5,888 | 9,803 | 2,825 |
Source: NCRB, Accidental Deaths & Suicides in India 2024, Tables 1.9 and 1.10. Each column adds up to the all-India figure in NCRB Table 1.7 (and, for lightning, Table 1.9).
What these numbers do and do not show
These are the best national figures we have, but they have limits. Read them with these points in mind.
- They are police records. NCRB prints “as per data provided by States/UTs” under every table. A death that never reaches a police station, such as a snakebite death in a remote village or a drowning that a family buries quietly, is not counted.
- Counts are not risk. Uttar Pradesh, Maharashtra and Madhya Pradesh top most lists partly because they have the most people. A bigger number does not mean a more dangerous State. To compare risk fairly you need deaths per lakh population on one official population basis. In Chapter 1, NCRB gives such rates only for all accidental deaths together (33.3 per lakh for India in 2024; Puducherry 71.3, Chandigarh 66.9, Ladakh 63.9, Haryana 59.6 and Maharashtra 59.4 at the top), using the National Commission on Population’s projected mid-year population. This page does not calculate cause-wise rates of its own.
- Reporting practice differs. A State may classify the same type of death under a different heading from its neighbour, and a year-to-year jump (Odisha’s fire deaths, Bihar’s drowning deaths) can reflect how deaths were recorded as much as what happened. NCRB lists drowning and flood as separate headings, so we cannot tell how a flood drowning was classified in each State.
- Some true tolls are far higher. The WHO figure for snakebite is about six times the NCRB count, as noted above.
- One year is a snapshot. Changes between 2023 and 2024 are shown for context. A single-year jump or fall is not a trend; check earlier years before drawing a conclusion.
- Deaths only. The tables also record injured persons, but injuries are not shown here, and they would add a very large number for road accidents in particular.
How to use and cite this page
If you are a journalist, student or researcher, use the NCRB tables themselves as your primary source. Cite “NCRB, Accidental Deaths & Suicides in India 2024, Table 1.10” (or Table 1.7 or 1.9, as shown) and link to the PDF. The links are listed under Sources in the side panel. For this page, please credit HowToSurvive.in as the compiler of the State rankings and the 2023 comparison, and cite the NCRB table for the underlying figure.
What to do with this information tonight
- Find your own State in the table above, note its biggest cause, and read the matching guide.
- If you ride or drive, wear a helmet or seatbelt every trip, and keep 112 saved in your phone.
- Fence or mark open water near your home, and keep children away from ponds, wells and swollen drains.
- Have an electrician check old wiring and fit an RCCB if you do not have one.
- When thunder starts, go indoors or into a vehicle, and stay away from lone trees and open fields.
What needs attention
- Road accidents are the largest single cause by a wide margin, at more than a third of all accidental deaths.
- Heat and sun stroke deaths rose from 804 to 1,832, the sharpest rise among major causes, and stampede deaths rose from 32 to 147.
- Accidental fire deaths fell 14.6%, though Odisha's fall from 1,032 to 442 is large enough to need checking.
- The top ten States hold 73.9% of road deaths, 76.1% of drowning deaths and 82.7% of electrocution deaths.
- Large States top most lists partly because of population, so counts must not be read as risk per person.
Controls that reduce risk
- Cite the NCRB table number and year with every figure you reuse.
- Use deaths per lakh on one official population basis before comparing States.
- Check earlier years before calling a change a trend.
- Wear a helmet or seatbelt and keep 112 saved in your phone.
- Fence or mark open water near homes and keep children away from it.
- Get old wiring checked and fit an RCCB at home.
Common unsafe practices
- Ranking States by number of deaths and calling the top State the most dangerous.
- Comparing a single year with the year before and calling it a trend.
- Treating police-recorded snakebite deaths as the full toll.
- Adding NCRB road-accident deaths to its wider traffic-accident figure, which also includes railway deaths.
- Reading Odisha's 2023 electrocution figure of 0 as a real zero.
- Quoting a rate per lakh for a single cause when NCRB's Chapter 1 gives rates only for all accidental deaths.



Leave a comment